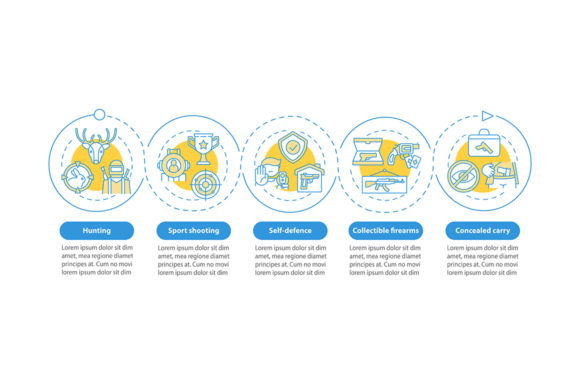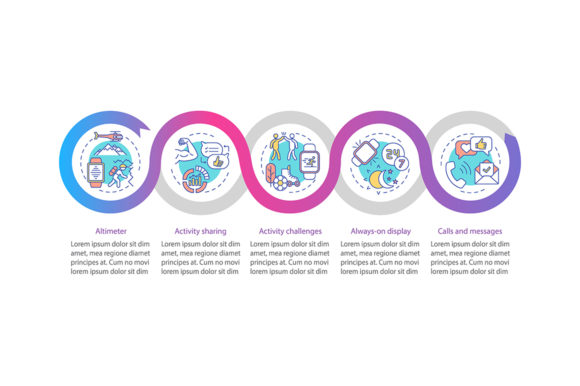
Smartwatch Functions Vector Infographic Guide
Visualizing complex wearable technology data requires more than standard charts; it demands a design language that mirrors the sleek, modern aesthetic of the devices themselves. A Smartwatch Functions Vector Infographic serves as a specialized bridge between raw technical specifications and user comprehension. For professionals creating content around health tech, fitness apps, or product launches, this template provides a structured framework to present information clearly. Rather than starting from scratch, designers and marketers can leverage pre-built elements like activity sharing visuals, challenge presentation layouts, and five-step data visualization flows to communicate value instantly. The vector format ensures that whether the graphic appears on a mobile app screen or a large-format trade show banner, the lines remain crisp and the message remains professional.
Streamlining Technical Communication with Vector Assets
The primary advantage of utilizing a dedicated smartwatch infographic template lies in its ability to standardize visual communication across multiple platforms. When explaining how a device tracks sleep cycles or measures heart rate variability, consistency builds trust. This specific vector asset includes linear icons and workflow layouts designed specifically for wearable interfaces. These are not generic symbols; they are crafted to match the UI patterns users already recognize from their own devices. By integrating these familiar visual cues, content creators reduce cognitive load for their audience. Readers do not have to decipher abstract representations because the infographic speaks the native visual language of smartwatch technology.
For educators and trainers, this level of specificity transforms dry manuals into engaging learning materials. Instead of listing features in bullet points, a process timeline chart can illustrate the journey from unboxing to mastering advanced health metrics. This narrative approach helps users understand not just what the watch does, but how it fits into their daily routine. The availability of EPS, AI, and SVG formats within the ZIP file means that these assets are fully editable. Instructors can adjust colors to match brand guidelines or modify iconography to reflect specific device models without losing the underlying structural integrity of the design.
Enhancing User Engagement Through Activity Sharing Visuals
Social connectivity is a defining feature of modern wearables, yet it is often poorly represented in marketing collateral. The activity sharing and challenges presentation design elements included in this template address this gap directly. Fitness communities thrive on competition and accountability, and your visuals should reflect that dynamism. Using the pre-designed challenge layouts allows bloggers and community managers to showcase leaderboards, badge achievements, and social feeds in a way that feels integrated rather than tacked on. This is particularly valuable for app developers who need to demonstrate social features to potential investors or beta testers without having a fully coded interface ready for screenshots.
These elements also serve a practical purpose in user retention strategies. When existing users see their activities visualized professionally in newsletters or update logs, it reinforces the value of the ecosystem. A well-designed infographic highlighting a new "Weekly Step Challenge" is significantly more effective than a plain text email. It creates excitement and provides a clear call to action. Because the files are vectors, marketing teams can quickly swap out data points or update challenge parameters each week, maintaining a fresh content stream without commissioning new custom illustrations every time.
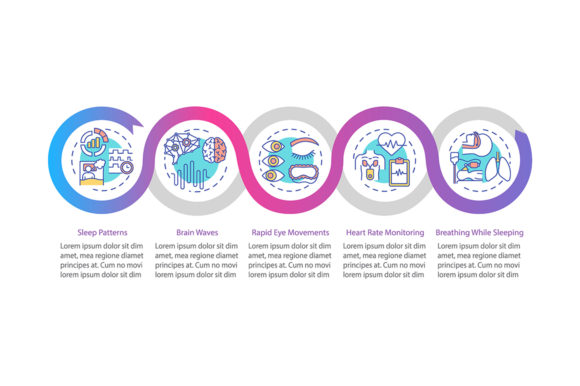
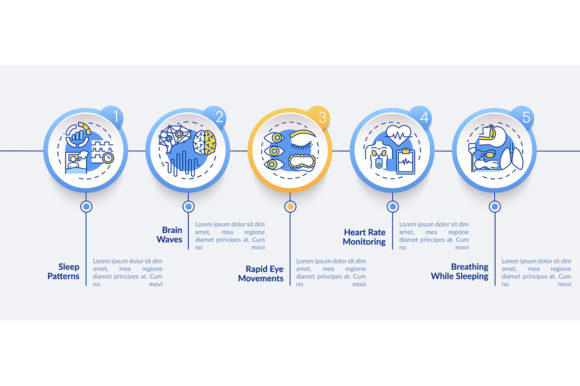
Mastering Data Visualization with Five-Step Flows
Wearable technology generates massive amounts of data, but raw numbers rarely inspire behavioral change. The five-step data visualization component of this template solves the translation problem. Whether you are explaining the calibration process for GPS tracking or the stages of sleep analysis, breaking complex processes into five distinct, digestible steps prevents information overload. This structure forces clarity. Content strategists must distill their message to its essence, ensuring that only the most critical information reaches the viewer. For freelancers and agencies working with health tech clients, this constraint is actually a creative asset, guiding the storytelling process toward better outcomes.
Consider a use case where a corporate wellness director needs to explain biometric feedback to employees. A dense paragraph about heart rate zones will likely be ignored. However, a linear workflow layout using the template’s five-step flow can guide an employee from "Resting State" through "Warm Up," "Target Zone," "Peak Performance," and finally "Recovery." Each step can be paired with a corresponding linear icon and brief descriptor. This visual progression makes the science accessible and actionable. The vector nature of the file allows the director to resize this graphic for a pocket-sized handout or a full-screen presentation slide while maintaining perfect legibility.
Practical Workflow Layouts for Product Documentation
Technical writers and UX designers often struggle to document smartwatch interactions because traditional flowcharts feel too industrial for consumer electronics. The workflow layout with linear icons offers a softer, more consumer-friendly alternative. These layouts are ideal for illustrating setup procedures, pairing processes, or notification management. Unlike rigid engineering diagrams, these vector elements balance technical accuracy with aesthetic appeal. They acknowledge that the end-user is a person, not a system administrator. This distinction is crucial for reducing support ticket volume; when users can visually follow a troubleshooting guide that looks like the product they own, they are more likely to resolve issues independently.
Small business owners selling aftermarket bands or accessories can also benefit from these workflow layouts. Demonstrating how a third-party accessory integrates with native watch functions requires clear visual instruction. Using the template’s linear icons to show the attachment mechanism or compatibility verification process adds a layer of professionalism that elevates the perceived value of the accessory. It signals to the customer that the seller understands the ecosystem deeply. Since the ZIP contains JPG and PNG exports alongside source files, even those without vector editing software can utilize high-quality static versions for quick e-commerce listings or social media posts.
Choosing the Right Format for Your Specific Needs
While the versatility of the Smartwatch Functions Vector Infographic template is significant, users should consider their specific technical capabilities and project requirements before diving in. The inclusion of AI and EPS files assumes access to professional vector editing software like Adobe Illustrator or Affinity Designer. For marketers or educators without these tools, the provided SVG, JPG, and PNG formats offer immediate utility, albeit with less customization potential. It is important to assess whether your team has the resources to edit source files or if pre-rendered assets will suffice. If extensive modification is required but internal skills are lacking, budgeting for a freelance designer to adapt the template may be more cost-effective than attempting to learn vector software mid-project.
Additionally, while the template covers a broad range of smartwatch functions, niche applications may require supplementary custom work. Specialized medical devices or industrial wearables might have unique sensors or interfaces not represented in the standard linear icon set. Users in these sectors should view this template as a foundational layer rather than a complete solution. Comparing this asset against other industry-specific templates is advisable to ensure comprehensive coverage. However, for general fitness, lifestyle, and consumer tech applications, the combination of activity sharing elements, challenge presentations, and process timelines provides a robust starting point that significantly accelerates production time.
Ultimately, the value of this resource extends beyond mere aesthetics. It represents a systematic approach to communicating wearable technology. By providing structured layouts for data, social interaction, and technical workflows, it removes the friction associated with visual content creation. Professionals can focus on refining their message and analyzing their results rather than wrestling with alignment tools and icon libraries. Whether used for investor pitch decks, user manuals, blog content, or educational workshops, the Smartwatch Functions Vector Infographic template empowers creators to deliver polished, informative, and visually cohesive content that resonates with a tech-savvy audience.