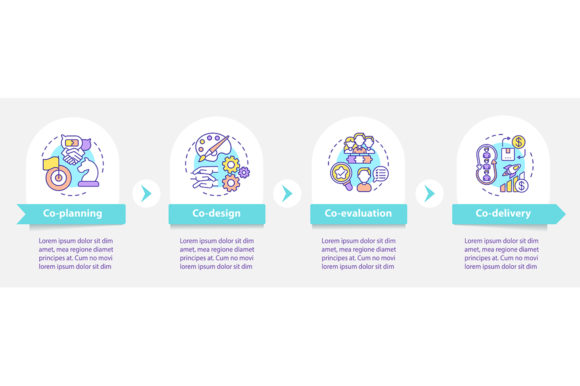
Co-design Fields Vector Infographic for Process Design
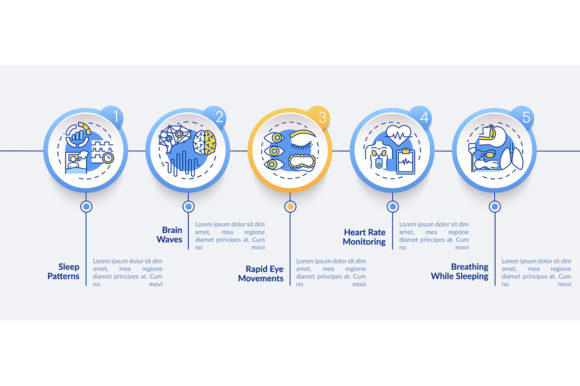
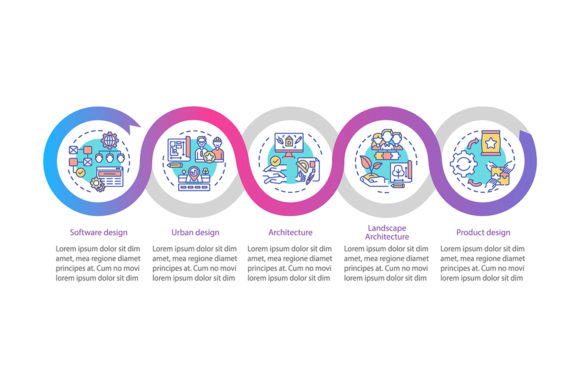
Visualizing complex workflows requires more than just placing text on a slide; it demands a structure that guides the viewer through a logical progression. The Co-design Fields Vector Infographic serves as a specialized visual framework designed to map out collaborative processes, software development cycles, or architectural planning stages. At its core, this template provides a five-step data visualization layout featuring linear icons and a clean timeline chart. Whether you are presenting a new app architecture to stakeholders or teaching design thinking in a classroom, this resource bridges the gap between abstract concepts and tangible understanding.
The value of such a template shifts significantly depending on who is using it and what they aim to achieve. A freelance graphic designer might prioritize the vector scalability for print materials, while a software project manager may care exclusively about how accurately the five steps represent their agile sprint cycle. Understanding these distinct needs helps determine if this specific infographic style aligns with your current project goals.
Why Visual Structure Matters Across Disciplines
Co-design is inherently multidisciplinary, involving input from various stakeholders to create a unified solution. Representing this collaboration visually can be challenging without a pre-established framework. This vector infographic template addresses that challenge by offering a neutral yet professional aesthetic suitable for multiple fields.
For software designers and developers, the linear icon set and process timeline chart are not merely decorative; they are functional communication tools. When explaining a backend integration or a user experience flow to non-technical clients, technical jargon often creates barriers. This template allows developers to replace code snippets with intuitive visual markers. The five-step format mirrors common development methodologies, making it easier to present progress reports or roadmap projections without building diagrams from scratch.
Architects and spatial designers face a different set of priorities. Their presentations often require high-resolution assets that maintain crisp lines when projected on large screens or printed on foam boards. Because this resource includes EPS and SVG formats, architects can scale the infographic to billboard size without pixelation. The minimalist design elements complement architectural renderings rather than competing with them, allowing the building design to remain the focal point while the process is explained clearly in the margins or introductory slides.
Evaluating Utility Based on Skill Level and Role
The decision to use a pre-made template like the Co-design Fields Vector Infographic often comes down to a trade-off between customization time and creative control. Different users navigate this trade-off differently.
Beginners and Educators
For those new to data visualization or information design, starting with a blank canvas can be paralyzing. Beginners benefit from this template because it provides a proven structural foundation. The five-step workflow layout teaches proper visual hierarchy and spacing. Instead of struggling to align shapes or choose compatible colors, students and novices can focus on the content itself. Educators find this particularly useful for creating consistent lecture materials. By using the same visual language across different lessons, they reduce cognitive load for students, allowing the class to focus on learning the material rather than deciphering a new diagram style every week.
Professionals and Agency Teams
Experienced designers and marketers evaluate this template through the lens of efficiency and brand adaptability. They are less concerned with learning how to make an infographic and more concerned with how quickly they can adapt this one to match client branding. The inclusion of editable vector files (EPS and SVG) is critical here. Professionals need to be able to change stroke weights, swap icons, and adjust color palettes in minutes. For an agency handling multiple accounts, having a reliable, flexible base template reduces billable hours spent on repetitive layout tasks while maintaining a high standard of visual quality.
Entrepreneurs and Small Business Owners
Business owners often lack dedicated design teams but still need to produce investor-grade pitch decks and internal documentation. For this group, the primary metrics are cost-effectiveness and ease of use. They likely do not have advanced illustration skills, so the availability of JPG and PNG formats alongside vector files offers necessary versatility. They can drag and drop a raster image into a PowerPoint presentation for a quick meeting, or send the vector file to a printer for a brochure later. The "co-design" aspect of the template also signals to investors and partners that the business values collaborative, structured problem-solving, adding a layer of professional credibility to their narrative.
Technical Flexibility and File Format Considerations
When selecting a digital asset, the technical specifications dictate long-term usefulness. This ZIP package contains four distinct file types, each serving a specific purpose in the production workflow.
- EPS (Encapsulated PostScript): Essential for professional printing and deep editing in Adobe Illustrator. This format preserves mathematical paths, ensuring that curves remain smooth at any magnification. It is the industry standard for logos and scalable graphics.
- SVG (Scalable Vector Graphics): Ideal for web-based presentations and responsive design. Unlike EPS, SVG is XML-based and can be manipulated with CSS or JavaScript. If you plan to embed the Co-design Fields Vector Infographic directly into a website or interactive dashboard, this is the required format.
- PNG (Portable Network Graphics): Supports transparency, making it perfect for overlaying the infographic onto colored backgrounds or photographs in slide decks. It uses lossless compression, retaining sharp edges for text and line art.
- JPG (Joint Photographic Experts Group): Best for quick previews, email attachments, or contexts where file size is strictly limited. While it lacks transparency and vector scalability, it offers universal compatibility across all devices and platforms.
Understanding these distinctions prevents frustration later in the project. A hobbyist creating a personal blog post might only ever open the PNG, while a publisher preparing a textbook layout will rely exclusively on the EPS. Matching the file type to the output medium ensures optimal quality and workflow speed.
Aligning the Template with Specific Project Goals
Not every project requires a five-step linear progression. Before downloading or implementing this resource, it is helpful to assess whether the underlying structure supports your specific narrative. The Co-design Fields Vector Infographic excels at showing sequential relationships, cause-and-effect chains, and phased approaches.
If your goal is to compare unrelated data points or show hierarchical organizational structures, a timeline chart may force your content into an unnatural shape. However, if you are documenting a product lifecycle, explaining a service delivery model, or outlining a research methodology, the linear flow is likely a perfect match. Creators should also consider the tone of the linear icons. Are they too technical for a consumer-facing health brochure? Are they too abstract for a precise engineering manual? The beauty of vector assets lies in their malleability; if the icons are close but not exact, they can serve as a starting point for custom illustration.
Ultimately, the effectiveness of this infographic template depends on how well it integrates into your existing ecosystem. For the marketer, it is a conversion tool that simplifies complex value propositions. For the educator, it is a pedagogical scaffold. For the architect, it is a presentation enhancer. By identifying your primary objective and technical constraints, you can leverage this asset to communicate more clearly and professionally, regardless of your field or expertise level.