Visualizing the Quantified Self: Leveraging Smartwatch Capabilities Infographics for Modern Health Tech Communication
The wearable technology sector has matured from a niche gadget market into a cornerstone of personal health management and professional productivity. As devices become more sophisticated, the challenge for marketers, product designers, and content creators shifts from explaining what a device is to articulating precisely what it does. This is where the Smartwatch Capabilities Infographic becomes an indispensable asset. It serves as the visual bridge between complex sensor data and consumer understanding, transforming technical specifications into compelling narratives about lifestyle enhancement and medical-grade monitoring.
For professionals and entrepreneurs in the digital health space, communication is no longer just about listing features; it is about demonstrating value through clarity. A well-executed smartwatch capabilities vector infographic template does more than decorate a presentation; it structures information in a way that aligns with how modern consumers process health data. By integrating specific design elements like ECG waveforms, sleep cycle graphs, and linear workflow icons, these visual tools address the growing demand for transparency and education in the wearable tech industry.
The Intersection of Design and Health Literacy
We are currently witnessing a significant shift in consumer expectations regarding health technology. Users are no longer satisfied with simple step counters. They demand clinical-grade insights, including electrocardiogram (ECG) readings, blood oxygen saturation levels, and granular sleep architecture analysis. However, raw data is often intimidating or confusing to the average user. The relevance of specialized infographic templates lies in their ability to democratize this complexity.
When utilizing a Smartwatch Capabilities Infographic, designers are not merely arranging shapes; they are engaging in health literacy advocacy. For instance, presenting an ECG feature requires more than a heart icon. It demands accurate waveform visualization that suggests precision and reliability without making unauthorized medical claims. Similarly, sleep app presentation design elements must distinguish between REM, deep, and light sleep stages in a manner that is instantly recognizable. These specific visual cues signal to the audience that the product is grounded in science, fostering trust in an increasingly crowded marketplace.
This trend extends beyond consumer marketing into B2B contexts. Investors, stakeholders, and healthcare partners require clear visualizations of product ecosystems before committing resources. A high-fidelity vector template allows startups and established firms to prototype their messaging strategy rapidly, ensuring that the value proposition of biometric monitoring is communicated effectively across pitch decks, white papers, and landing pages.
Addressing Evolving Workflow and Content Needs
The pace of innovation in wearable tech outstrips traditional design cycles. New sensors and algorithms are released quarterly, requiring marketing and creative teams to update assets constantly. This dynamic environment has changed workflows, making editable, scalable vector assets a necessity rather than a luxury. Rasterized images cannot keep up with the iterative nature of tech product development.
Professionals are paying attention to comprehensive template packages because they solve the scalability problem. Access to source files ensures that when a new sleep tracking algorithm launches, the corresponding infographic can be updated in minutes rather than days. This agility supports a broader business trend toward modular content creation, where core visual assets are adapted across multiple channels—from social media carousels to detailed investor reports—without losing brand consistency or technical accuracy.
Structuring Complexity: The 5-Step Data Visualization Framework
One of the most critical aspects of communicating smartwatch functionality is guiding the user through a logical journey. Wearables do not operate in a vacuum; they are part of a continuous feedback loop. Effective infographics often employ a structured approach to mirror this user experience. Utilizing a process timeline chart or a dedicated data visualization section helps break down abstract concepts into digestible steps.
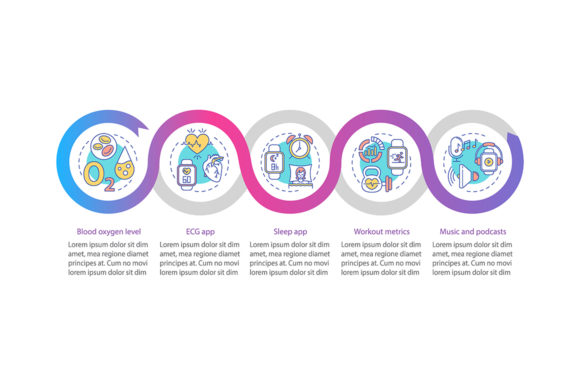
When designing or selecting a Smartwatch Capabilities Infographic, consider implementing a five-step visualization framework to narrate the data journey:
- Data Acquisition: Visualize the physical interaction between the sensor and the body. Use linear icons to depict optical heart rate sensors, electrical heart sensors, or accelerometers making contact with the wrist. This grounds the technology in physical reality.
- Signal Processing: Represent the conversion of analog biological signals into digital data. Abstract waveforms or node-based graphics work well here to suggest algorithmic processing and noise filtering without overwhelming the viewer with code.
- Contextual Analysis: Show how raw data is interpreted against baselines or historical trends. This is where sleep app presentation design elements shine, illustrating how a single night’s rest is compared to weekly averages to provide actionable insights.
- Actionable Insight Delivery: Depict the notification or dashboard interface. The visualization should emphasize clarity and immediacy, showing how the user receives information in real-time through haptics or visual alerts.
- Behavioral Feedback Loop: Close the circle by illustrating the long-term outcome. Use trend lines or achievement badges to represent habit formation, improved health metrics, or goal attainment over time.
This structured approach transforms a static image into a storytelling device. It moves the conversation from "what the watch has" to "how the watch improves life," which is the ultimate goal of any health tech communication strategy.
The Strategic Value of Multi-Format Asset Libraries
In professional creative workflows, versatility is paramount. The utility of a smartwatch capabilities vector infographic template is significantly amplified by the inclusion of diverse file formats. A comprehensive ZIP file containing EPS, JPG, PNG, SVG, and AI files addresses the distinct needs of various stakeholders within an organization.
- AI and EPS Files: These are the master keys for designers. They allow for infinite scaling and deep customization, enabling teams to adjust colors to match brand guidelines, modify iconography to reflect specific hardware revisions, or rearrange layout components for different aspect ratios.
- SVG Format: Essential for web developers and digital marketers. Scalable Vector Graphics ensure that infographics remain crisp on high-DPI mobile screens and retina displays while maintaining small file sizes for optimal page load speeds—a critical factor for SEO and user experience.
- PNG and JPG: These raster formats serve immediate needs for non-designers. Product managers, sales teams, and social media coordinators can insert these directly into slide decks, emails, or CMS platforms without needing specialized software, facilitating faster internal communication and external publishing.
This multi-format approach reflects a mature understanding of modern content supply chains. It acknowledges that a single visual asset must live in many environments simultaneously, and each environment has unique technical constraints. By providing a complete suite of file types, template creators empower organizations to maintain visual integrity across every touchpoint.
Connecting Visuals to Broader Industry Trends
The rise of specialized smartwatch infographics is symptomatic of larger developments in the technology and wellness sectors. We are moving toward an era of proactive health management, where wearables serve as early warning systems rather than passive trackers. As regulatory bodies like the FDA clear more wearable features for medical use, the standard for visual communication rises accordingly.
Marketing materials must now balance engagement with compliance. A Smartwatch Capabilities Infographic that accurately depicts ECG functionality or sleep apnea detection aids helps companies navigate this delicate balance. Precise visuals reduce ambiguity, ensuring that consumers understand the distinction between wellness features and medical diagnostics. This precision protects brands from reputational risk while educating consumers about the legitimate capabilities of their devices.
Furthermore, the aesthetic of these infographics influences consumer perception of quality. In a market saturated with generic stock photography, custom-designed linear icons and bespoke data visualizations signal premium positioning. They suggest that the company cares as much about the clarity of its communication as it does about the engineering of its hardware. For freelancers and agencies serving health tech clients, offering this level of visual sophistication is a key differentiator.
Practical Applications for Creators and Marketers
Beyond theoretical benefits, these templates offer immediate practical utility. Consider a freelance designer tasked with creating a crowdfunding campaign for a new fitness tracker. Using a pre-built workflow layout with linear icons allows them to focus on customizing the unique selling points rather than drawing generic watch straps from scratch. This efficiency translates to higher margins and faster turnaround times.
For corporate marketing teams, these assets support A/B testing of value propositions. By swapping out different data visualization modules within the same template, teams can test whether audiences respond better to sleep quality metrics or cardiovascular health stats. The modularity of vector templates makes this experimentation feasible at scale, turning design assets into tools for market research.
Ultimately, the Smartwatch Capabilities Infographic is more than a collection of vectors; it is a strategic instrument for navigating the complexities of the modern wearable landscape. It empowers professionals to translate sophisticated biometric technology into accessible, trustworthy, and visually engaging content. As the line between consumer electronics and personal healthcare continues to blur, the ability to visualize this convergence clearly will remain a defining competency for successful brands and creators alike. Investing in high-quality, versatile visual templates is not just a design choice—it is a commitment to clearer communication in an increasingly data-driven world.