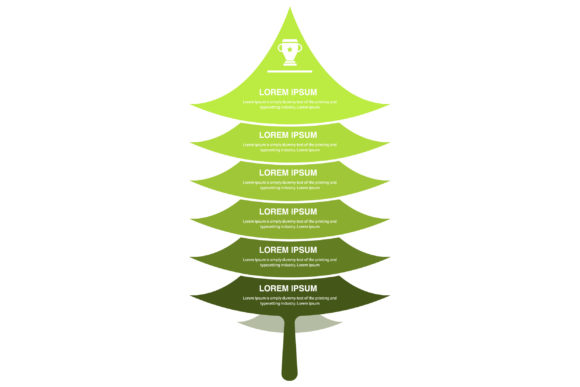
Mastering Visual Hierarchy: The Complete Guide to Vector-Based Tree Infographics
In an era defined by information overload, the ability to distill complex data into digestible visual formats is more than just a design trend; it is a fundamental communication skill. Among the various tools available to designers, educators, and business professionals, the tree infographic stands out as one of the most effective methods for organizing hierarchical information. However, not all infographics are created equal. The distinction between standard raster graphics and professional vector-based assets can determine whether a project looks amateurish or polished. Understanding the technical and practical advantages of fully editable, scalable vector tree infographics is essential for anyone looking to elevate their visual storytelling.
The Cognitive Power of Tree Structures
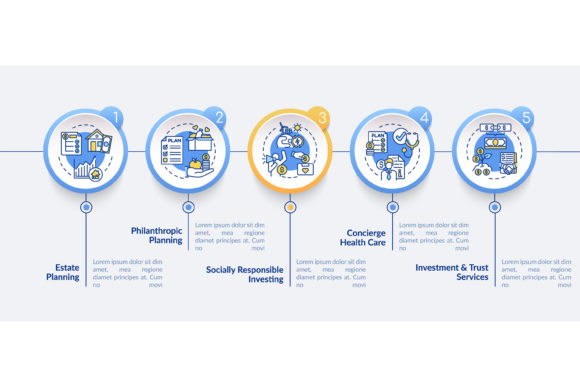
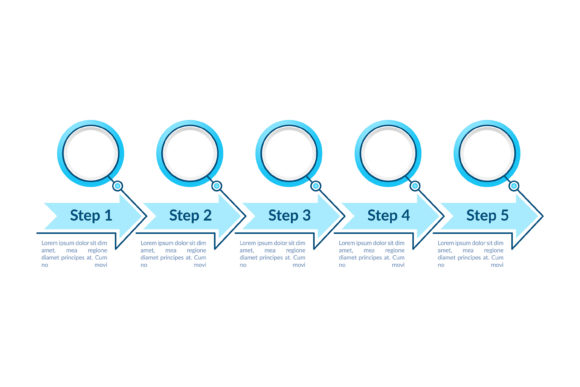
To understand why tree infographics are so prevalent, we must first look at how the human brain processes information. We are naturally inclined to categorize data. From biological taxonomy to corporate organizational charts, the "tree" metaphor mirrors our cognitive mapping of relationships. A root represents a foundation or origin, branches signify divergence or categories, and leaves represent specific outcomes or data points.
This structure is universally recognized across cultures and industries. In education, teachers use tree diagrams to explain sentence grammar or evolutionary biology. In business, project managers utilize work breakdown structures that mimic tree roots to allocate resources. In technology, site maps and directory structures rely entirely on this logic. When you choose a tree infographic template, you are leveraging thousands of years of intuitive human understanding. You are not forcing the audience to learn a new system; you are presenting information in a format they already know how to read.
Why Vector Format Matters for Professional Results
A common misconception among beginners is that all digital images function the same way. This assumption often leads to frustration when a crisp image on a laptop screen turns pixelated and blurry when projected onto a conference room wall or printed on a large banner. This issue stems from the difference between raster and vector graphics.
Raster images, such as standard JPGs or PNGs found on many free stock sites, are made of a fixed grid of pixels. If you zoom in or enlarge them beyond their original dimensions, the software has to guess what color the new pixels should be, resulting in distortion. Vector graphics, conversely, are defined by mathematical equations. Lines, curves, and shapes are calculated in real-time based on coordinates. This means a vector-based tree infographic can be scaled to the size of a postage stamp or a billboard without losing a single ounce of resolution.
For professional deliverables, this scalability is non-negotiable. Whether you are designing a mobile app interface or a trade show display, vector assets ensure your work remains sharp and authoritative in every context. Furthermore, because vectors are mathematically defined, file sizes are often significantly smaller than high-resolution rasters, making them easier to store, share, and embed in web environments via SVG.
The Importance of Full Editability
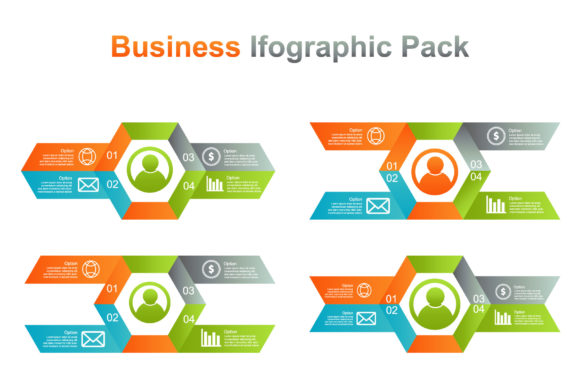
Scalability addresses size, but editability addresses utility. A static image of a tree diagram is merely a reference; a 100% vector editable file is a functional tool. High-quality vector packages allow users to manipulate every individual element. Need to change the color scheme to match your brand guidelines? You can adjust the fill and stroke colors globally in seconds. Need to add a fifth branch to accommodate a new department? You can duplicate and reposition nodes without redrawing the entire graphic.
This level of control transforms a generic template into a bespoke asset. It saves hours of design time while ensuring consistency. For agencies and freelancers, this efficiency directly impacts profitability. For internal teams, it ensures that non-designers can update charts as data changes without needing to request a complete redesign from the creative department.
Understanding the File Ecosystem
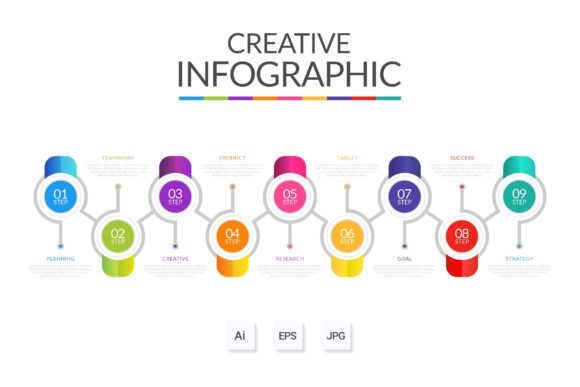
When acquiring premium vector assets, it is crucial to understand what each included file format offers. A comprehensive package typically includes AI, EPS, SVG, JPG, and PNG files, each serving a distinct purpose in the modern workflow.
- AI (Adobe Illustrator) File: This is the native source file. It retains all layers, artboards, and editing capabilities specific to Adobe Illustrator. It is the master copy from which all other formats should be derived.
- EPS (Encapsulated PostScript): The industry-standard exchange format. EPS files are compatible with almost all vector editing software, including CorelDRAW, Affinity Designer, and open-source alternatives like Inkscape. They ensure interoperability across different platforms.
- SVG (Scalable Vector Graphics): An XML-based vector format designed specifically for the web. SVGs can be embedded directly into HTML, styled with CSS, and even animated with JavaScript. They are essential for responsive web design where clarity at any screen size is required.
- JPG Image: A compressed raster format best suited for quick previews, email signatures, or documents where transparency is not needed. While not editable, it provides universal compatibility for viewing.
- PNG Image with Transparent Background: Unlike JPGs, PNGs support alpha channels. This allows the tree infographic to float seamlessly over colored backgrounds, photos, or dark modes without an unsightly white box surrounding it. This is the go-to format for PowerPoint presentations and social media overlays.
Practical Applications Across Industries
The versatility of editable tree infographics extends far beyond simple org charts. Their adaptability makes them relevant in diverse fields.
Corporate Strategy and Reporting
In annual reports and investor decks, clarity builds trust. Decision trees help stakeholders visualize risk assessment scenarios. Product lineage trees show the evolution of a company’s offerings over time. Because these documents often move between digital screens and high-quality print, the vector nature of the assets ensures the data looks impeccable regardless of the medium.
Educational Content Creation
Educators and e-learning developers face the challenge of maintaining engagement. Static textbooks are being replaced by interactive digital content. SVG tree diagrams can be integrated into Learning Management Systems (LMS) to create clickable knowledge maps. Students can explore branches to reveal deeper content, turning passive observation into active learning. The transparent PNG versions are equally valuable for creating clean, distraction-free worksheets and slide decks.
User Experience (UX) Design
Information architecture is the backbone of UX. Designers use tree structures to map out user flows and navigation hierarchies before writing a single line of code. Having a library of scalable vector trees allows UX professionals to rapidly prototype and iterate. Because SVGs are code-friendly, the same asset used in the wireframe phase can often be refined and implemented directly into the final product interface.
Best Practices for Implementation
Owning high-quality assets is only the first step; using them effectively requires intentionality. Even the most beautiful vector tree can fail if it violates basic design principles.
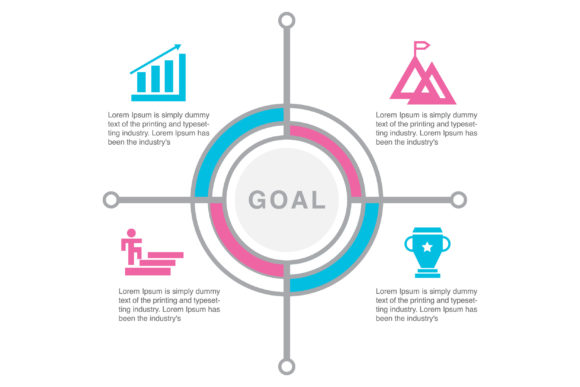
- Maintain Visual Balance: Ensure that branches are evenly spaced and aligned. Asymmetry can imply hierarchy where none exists, confusing the reader. Use the alignment tools in your vector editor to distribute nodes mathematically.
- Limit Color Complexity: While vectors allow for infinite gradients and effects, restraint is key. Use color semantically to group related categories rather than decoratively. A consistent palette aids memory retention.
- Prioritize Readability: Scalability does not excuse tiny text. Ensure font sizes remain legible at the intended viewing distance. Remember that while lines scale infinitely, text may need manual adjustment when resizing dramatically.
- Leverage White Space: Do not feel compelled to fill every node. Negative space helps the eye navigate the structure. A cluttered tree defeats the purpose of simplification.
Future-Proofing Your Visual Assets
Technology evolves rapidly. Screen resolutions increase, print technologies advance, and new platforms emerge. Raster-based workflows lock you into the limitations of today's hardware. By investing in fully editable vector assets, you are future-proofing your content library. An AI or EPS file created today will remain perfectly usable on devices ten years from now that we cannot yet imagine.
Furthermore, the rise of AI-assisted design tools is changing how we interact with graphics. Many emerging tools can parse SVG code to automatically generate variations or extract data. Owning structured vector files positions you to take advantage of these innovations, whereas flat images remain dead ends.
Conclusion
The tree infographic is more than a decorative element; it is a sophisticated instrument for organizing human knowledge. When combined with the technical superiority of vector formats, it becomes a resilient, adaptable, and professional asset suitable for any context. Whether you are explaining a complex algorithm to engineers, teaching biology to students, or presenting quarterly growth to shareholders, the quality of your visuals reflects the quality of your thinking.
By choosing resources that offer 100% vector editability, high-quality construction, and comprehensive file inclusion—from AI and EPS to SVG and transparent PNGs—you equip yourself with the flexibility to communicate clearly in a noisy world. Embrace the scalability, master the editability, and let the natural logic of the tree structure bring clarity to your next project.