Employee Reboarding Vector Infographic: Visualizing the Return-to-Work Journey
Bringing an employee back into the fold after a significant absence is fundamentally different from onboarding a new hire. Whether someone is returning from parental leave, recovering from burnout, transitioning back from medical leave, or rejoining after a layoff and rehiring cycle, the psychological contract has changed. This is where an Employee Reboarding Vector Infographic becomes more than just a design asset; it serves as a strategic communication tool. Unlike dense policy documents that often go unread, a well-designed vector infographic translates complex reintegration processes into digestible, empathetic visual narratives.
For HR professionals, team leads, and internal communicators, this template bridges the gap between administrative requirements and human connection. It acknowledges that worker mental health is inextricably linked to how clearly and compassionately a return-to-work plan is communicated. By utilizing scalable vector graphics, organizations can adapt these visuals for everything from high-resolution printed welcome kits to digital Slack announcements without losing clarity or emotional resonance.
When Visual Clarity Supports Mental Health
The primary reason to use a specialized reboarding template rather than a generic onboarding graphic is the specific focus on worker mental health. Returning employees often experience anxiety about changed workflows, new team members, or altered expectations. A text-heavy email outlining their first week can inadvertently increase cognitive load. In contrast, a visual workflow layout with linear icons provides a sense of predictability and safety.
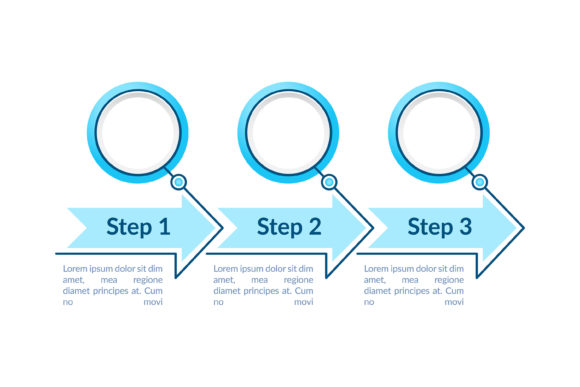
Consider a scenario where an employee returns after six months of medical leave. Their capacity for processing detailed information may be temporarily reduced. A process timeline chart that visually maps out their first 30 days allows them to see the "ramp-up" period at a glance. Seeing that weeks one and two are designated for "reconnection" and "training" rather than "performance output" validates their need for adjustment time. The vector format ensures these sensitive messages remain crisp and professional across all devices, reinforcing that the organization has thoughtfully prepared for their return.
Practical Applications Across Business Scenarios
The versatility of an Employee Reboarding Vector Infographic template lies in its adaptability to various real-world situations. Different stakeholders utilize these assets to solve distinct communication challenges:
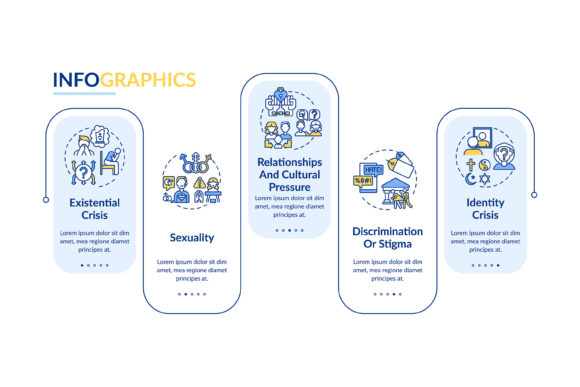
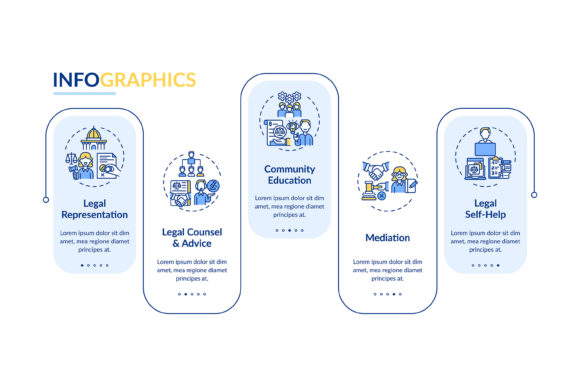
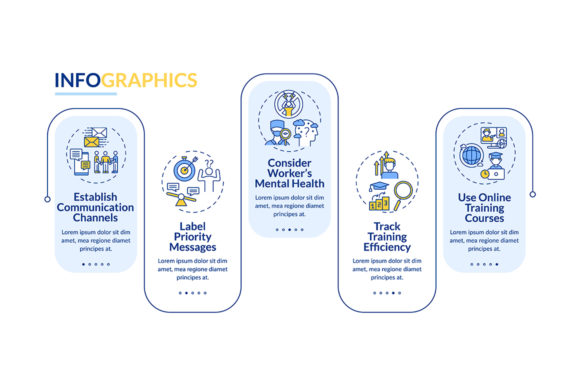
- HR Departments Managing Parental Leave Returns: Parents returning to work often struggle with identity shifts and logistical overwhelm. HR teams use the 5-step data visualization feature to outline flexible scheduling options, benefits refreshers, and mentorship check-ins. The visual nature helps normalize the transition, making support resources feel accessible rather than bureaucratic.
- Managers Reintegrating Remote Teams: For hybrid or fully remote workers, reboarding lacks physical cues. Managers can embed SVG versions of the infographic directly into Notion pages or Confluence wikis. The linear icon workflow acts as a digital anchor, replacing the casual desk-side chats that used to signal progress and belonging.
- L&D Specialists Designing Refresher Courses: Skills atrophy during long absences. Learning and Development professionals use the courses presentation design elements within the template to structure training modules. Instead of a boring list of compliance links, they present a visual learning path that respects the employee’s existing expertise while highlighting necessary updates.
- Internal Comms During Restructuring: When employees are reassigned to new roles internally, they are essentially being reboarded. Communications teams use the EPS files to create large-format posters for office spaces or high-quality PDFs for town halls, visually mapping the change management process to reduce uncertainty.
Deconstructing the 5-Step Data Visualization
Effective reboarding isn't vague; it follows a structured cadence. The template’s built-in 5-step data visualization is designed to mirror best practices in organizational psychology. When customizing this section, consider how each step translates to actual employee experience:
- Pre-Arrival Connection: Before day one, send a visual teaser of the team’s current state. This reduces "first-day jitters" by providing context.
- Welcome & Psychological Safety: Focus the second step on culture and wellbeing checks rather than paperwork. Use warm, inviting iconography to signal support.
- Role Recalibration: Visually distinguish between "old responsibilities" and "new expectations." This clarity prevents role ambiguity, a major stressor for returning staff.
- Skill Bridging: Map out specific training interventions using the course presentation elements. Show progress bars or milestones to gamify the learning curve gently.
- Feedback & Integration Loop: The final step should visualize ongoing dialogue. Show that reboarding is a cycle, not a cliff edge, emphasizing sustained support.
Technical Flexibility for Modern Workflows
Creators and marketers understand that content must live in multiple ecosystems simultaneously. The inclusion of EPS, JPG, PNG, and SVG formats in the ZIP file addresses this fragmentation practically. You aren't just downloading a picture; you are acquiring a multi-format asset library.
The SVG format is particularly crucial for web-based reboarding portals. Because it is code-based, you can animate specific elements (like the timeline progressing) using CSS or JavaScript, creating an interactive experience for tech-savvy teams. Meanwhile, the EPS file remains the gold standard for print. If your company produces physical welcome boxes or branded notebooks for returning executives, the EPS ensures lines stay sharp at any scale. The PNG and JPG variants serve immediate needs: quick email signatures, intranet banners, or slide deck backgrounds where editing isn't required. This technical breadth means you never have to compromise quality based on the medium.
Strategic Considerations Before Implementation
While the Employee Reboarding Vector Infographic template is a powerful starting point, successful application requires thoughtful customization. Before applying this resource, evaluate your specific organizational context. A template designed with linear icons suggests a structured, sequential process. If your reboarding approach is highly organic or non-linear, you may need to heavily modify the workflow layout to avoid misrepresenting the experience.
Additionally, consider the tone conveyed by the color palette and typography. Vector templates are easily recolored, but you must ensure the chosen aesthetics align with your employer brand and the sensitivity of the situation. Bright, aggressive colors might energize a sales team but could feel jarring to someone returning from grief leave. Always test the visual hierarchy: does the most important information (e.g., mental health resources, key contacts) stand out immediately? Data visualization should clarify, not decorate.
Finally, remember that the infographic is a map, not the territory. It works best when paired with genuine human interaction. Use the template to set expectations and provide structure, but ensure managers are trained to have the conversations that the graphics prompt. When used as part of a holistic strategy, this vector infographic transforms reboarding from an administrative checklist into a meaningful ritual of renewal and respect.