Digital Inclusion Benefits: Visualizing Impact Without Losing Clarity
When organizations and educators discuss digital inclusion benefits, they are addressing a critical shift in how society accesses opportunity. This concept goes far beyond simply providing hardware or internet connections; it encompasses digital literacy, accessible content design, affordable connectivity, and culturally relevant support systems. For marketers, entrepreneurs, and educators tasked with communicating these complex advantages, the challenge often lies in translation. How do you turn abstract socioeconomic improvements into a compelling narrative that stakeholders understand immediately? This is where high-quality vector infographic templates and process timeline charts become essential tools. However, selecting and utilizing these design assets requires a strategic eye to avoid common pitfalls that can undermine your message.
The Risk of Oversimplifying Complex Data
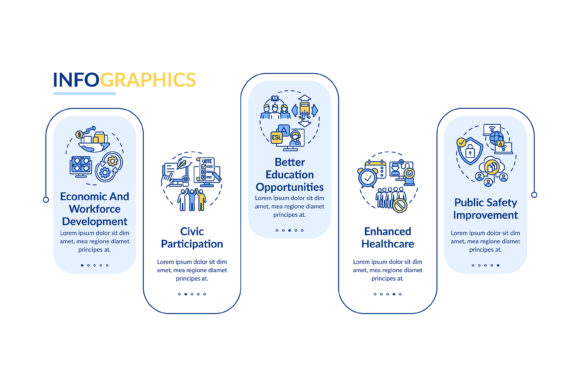
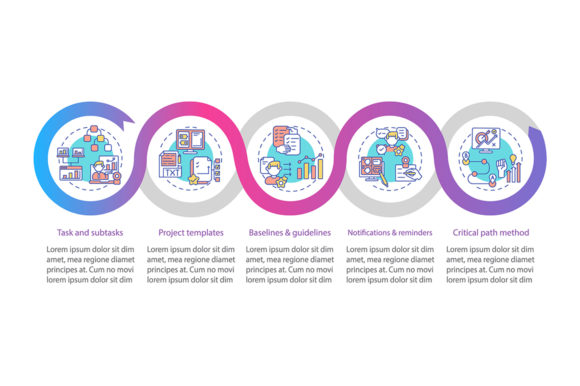
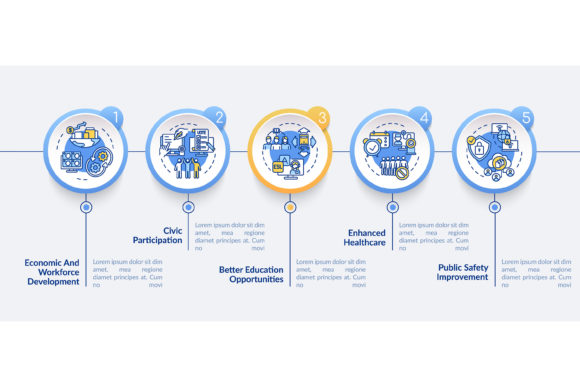
A frequent mistake when presenting digitalization presentation design elements is reducing multifaceted social issues to overly simplistic icons. While a linear icon set is excellent for workflow layouts, using generic symbols to represent profound concepts like "digital equity" or "community empowerment" can feel dismissive or inaccurate. Many creators download a template featuring five steps and force their unique data into that structure without considering if a linear progression actually reflects reality. Digital inclusion is rarely a straight line; it is often cyclical or ecosystem-based.
If you rely solely on a rigid process timeline chart because it looks organized, you risk misrepresenting the user journey. For example, showing digital literacy as Step 3 after "Device Access" ignores the reality that many users need literacy training before they can effectively utilize a device. Before committing to a specific workflow layout, map out your actual data narrative first. Choose templates that offer modular components rather than fixed sequences. This flexibility allows you to rearrange the five steps or expand them into a more nuanced data visualization that respects the complexity of the subject matter.
File Format Compatibility and Scalability Issues
Technical oversight is another area where well-meaning professionals stumble. You might find a beautiful digital inclusion benefits vector infographic template, but failing to verify the file type can lead to significant production delays. While JPG and PNG files are universally compatible, they are raster-based. If you attempt to resize a JPG for a large-format presentation or a detailed report, pixelation will destroy the professional aesthetic you are trying to achieve. Furthermore, raster images cannot be edited to update statistics or change color schemes to match your brand guidelines.
Always prioritize source files like AI (Adobe Illustrator), EPS, or SVG. These vector formats ensure infinite scalability and editability. A common misunderstanding is assuming all vector files are created equal. Some EPS files are actually embedded rasters disguised as vectors. Before purchasing or downloading, open the file in your editing software to confirm that the paths are live and editable. If you are working across different platforms or sharing with clients who lack Adobe Creative Cloud, SVG is often the safest middle ground. It retains vector quality for web and digital presentations while remaining accessible without proprietary software. Securing the correct format upfront saves hours of redrawing work later.
Navigating Accessibility in Design Assets
There is a profound irony in using inaccessible design elements to promote digital inclusion benefits. Many infographic templates prioritize visual flair over readability, utilizing low-contrast color palettes or intricate typography that fails WCAG (Web Content Accessibility Guidelines) standards. If your presentation about digital equity cannot be read by someone with visual impairments or cognitive processing differences, the medium contradicts the message. This oversight not only alienates part of your audience but also exposes organizations to compliance risks.
When evaluating a template, test the color contrast ratios immediately. Do not assume the designer’s default palette is accessible. Look for templates that use distinct shapes and patterns alongside color to convey meaning, ensuring that information isn't lost for colorblind viewers. Additionally, check the layer organization in AI or EPS files. Well-structured templates separate text, background, and graphical elements, making it easier to adjust font sizes and spacing for better legibility. Prioritizing accessibility in your asset selection demonstrates a genuine commitment to the values you are advocating for.
Ensuring Cultural Relevance and Representation
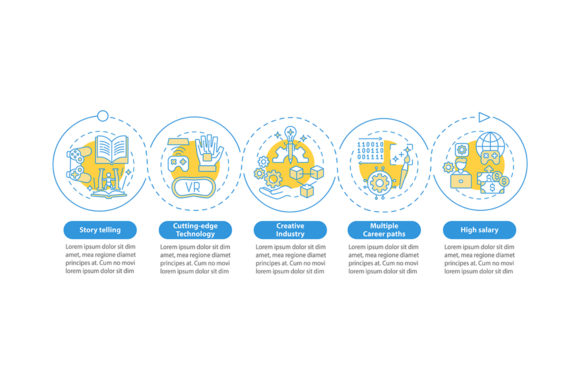
Visual representation matters deeply in this space. A subtle but damaging error occurs when creators use stock vector art that relies on stereotypes or lacks diversity. Generic silhouettes or homogeneous character illustrations can make digital inclusion initiatives feel performative rather than authentic. When your audience sees themselves reflected accurately in the data visualization, trust increases. Conversely, mismatched imagery creates distance and skepticism.
Review the illustration style within the template critically. Are the figures diverse in age, ability, and ethnicity? Do the icons reflect modern technology and varied environments, or do they rely on outdated tropes? Sometimes, the best approach is to choose minimalist, abstract workflow layouts with linear icons rather than human figures if you cannot find representative artwork that feels authentic. Abstract geometric representations of connectivity and growth are often safer and more inclusive than poorly executed character art. Always customize the visual language to resonate with the specific community you are serving rather than settling for generic defaults.
Strategic Evaluation Before Downloading
To maximize efficiency and impact, establish a checklist before acquiring any digitalization presentation design elements. First, define the specific metric or story arc you need to visualize. Are you comparing broadband adoption rates, illustrating a training curriculum, or mapping stakeholder relationships? Knowing this prevents you from downloading a pretty but useless template. Second, assess the licensing terms. Some free or low-cost templates restrict commercial use or require attribution, which may not be suitable for corporate reports or paid educational courses.
Finally, consider the long-term utility of the asset. A high-quality digital inclusion benefits vector infographic template should be versatile enough to serve multiple campaigns. Look for comprehensive kits that include matching slide decks, social media cards, and print-ready layouts. This consistency strengthens brand recognition and ensures your message remains cohesive across channels. By approaching asset selection with the same rigor you apply to data collection, you transform simple graphics into powerful instruments for advocacy and education. The goal is not just to fill space on a slide, but to clarify the path toward a more equitable digital future through precise, respectful, and technically sound visualization.